
NC State PhD researchers taught high school students the complete computer vision pipeline by first converting ankle accelerometer data into RGB spectrograms, then using Roboflow to label, train, and evaluate image classification models that distinguish standing, walking, and running. The approach shows how sensor time-series data can be reframed as image classification, the same technique underlying activity recognition in wearable devices, making it accessible enough for students with no prior machine learning experience to train high-performing models in a single session.
This is a guest post, courtesy of Jeremy Park and Sanjana Banerjee, who are Graduate Research Assistants and Ph.D. candidates at North Carolina State University, specializing in AI/Machine Learning.
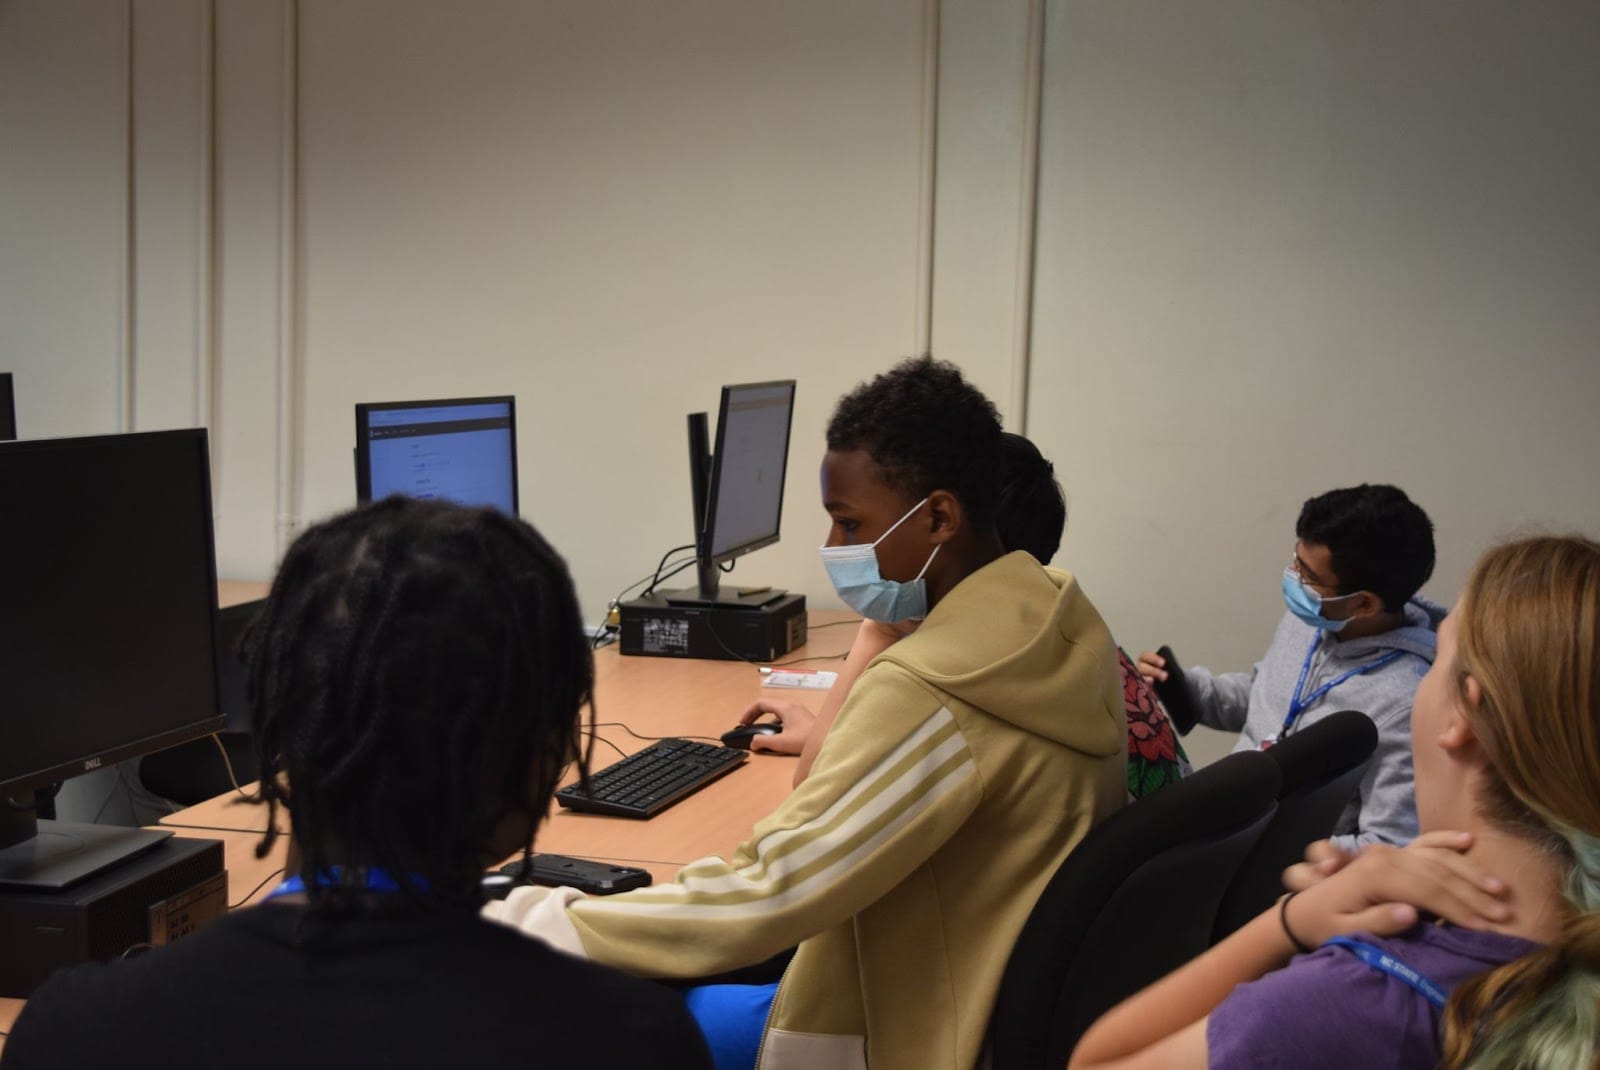
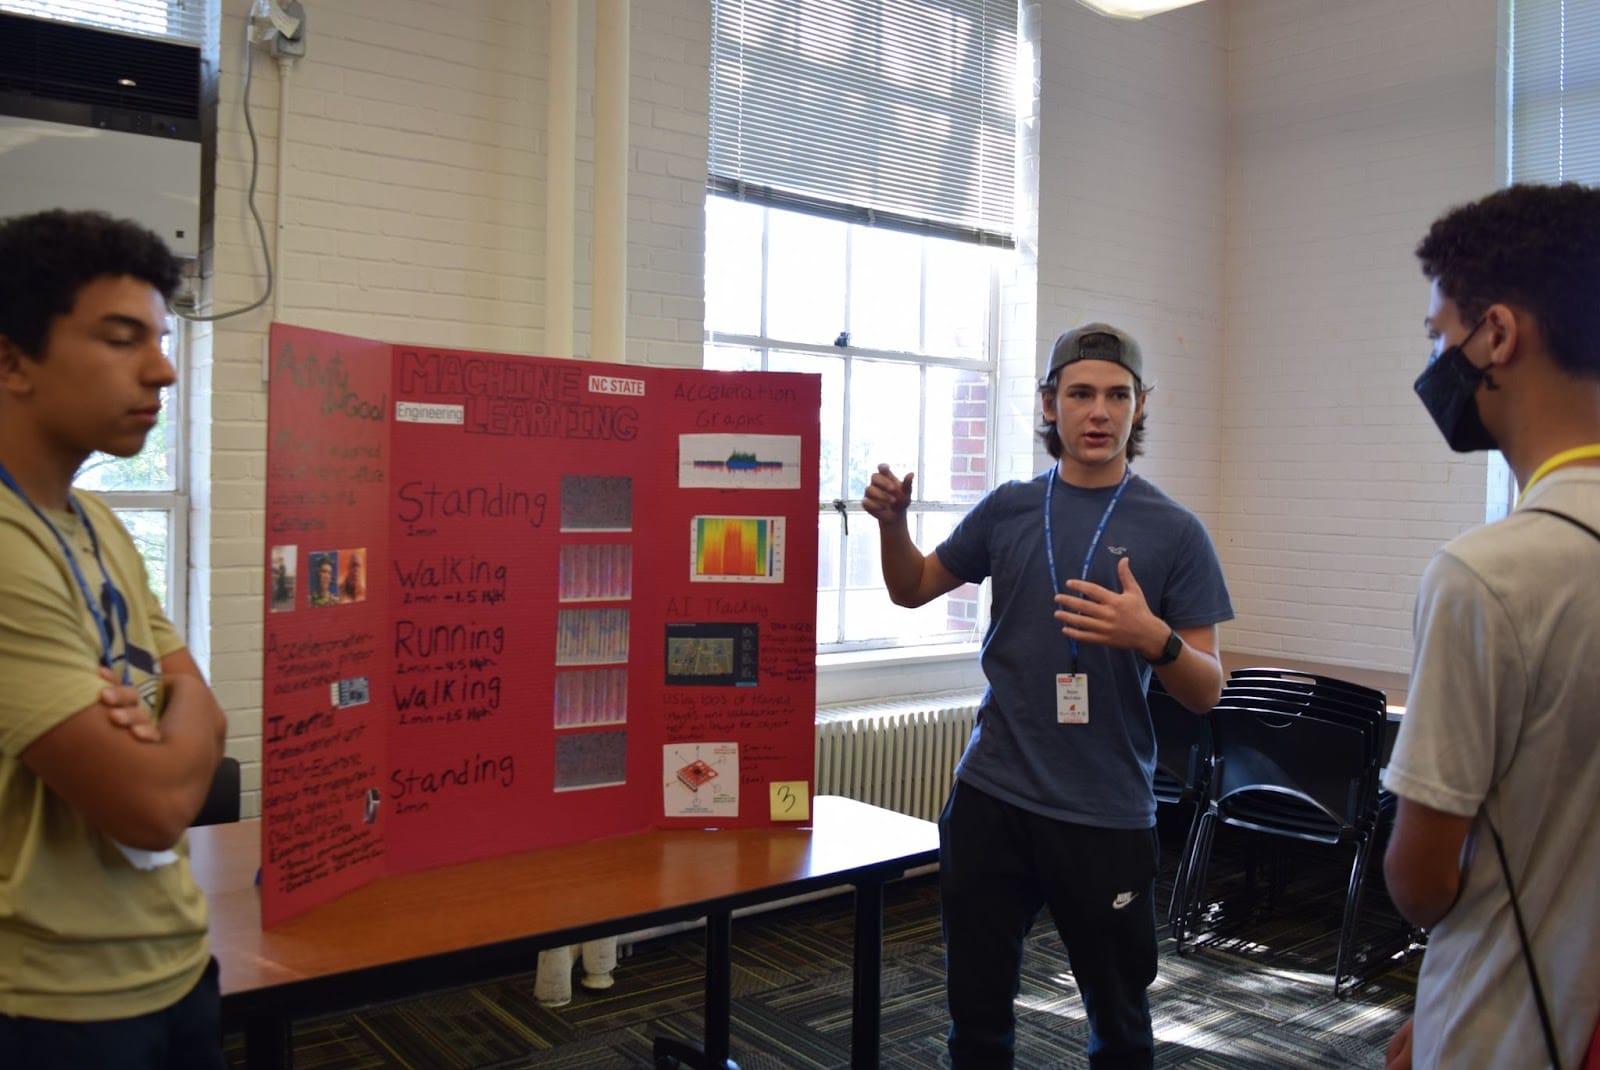
Every summer at North Carolina State University (NC State), the College of Engineering hosts week-long day camps for high school students to learn about and experience engineering first-hand.
As Ph.D. students in the Active Robotics Sensing Lab (ARoS) under the supervision of Dr. Edgar Lobaton, we developed, in conjunction with The Engineering Place, a set of activities to walk high school students through the entire computer vision pipeline -- from data collection to model prediction -- using Roboflow.
Standing, Walking, and Running
Standing, walking, and running occurs at different speeds for most people. We can measure these differences using a small Bluetooth sensor strapped to the ankle, then train a machine learning model to automatically classify states of standing, walking, and running.
This is how wearable health devices such as the Apple Watch, Fitbit, and Oura Ring are able to automatically detect your workout and activities -- using a variety of sensors and machine learning techniques.
We sought to create our own basic activity recognition model to teach high school students how machine learning works.
The Experiment
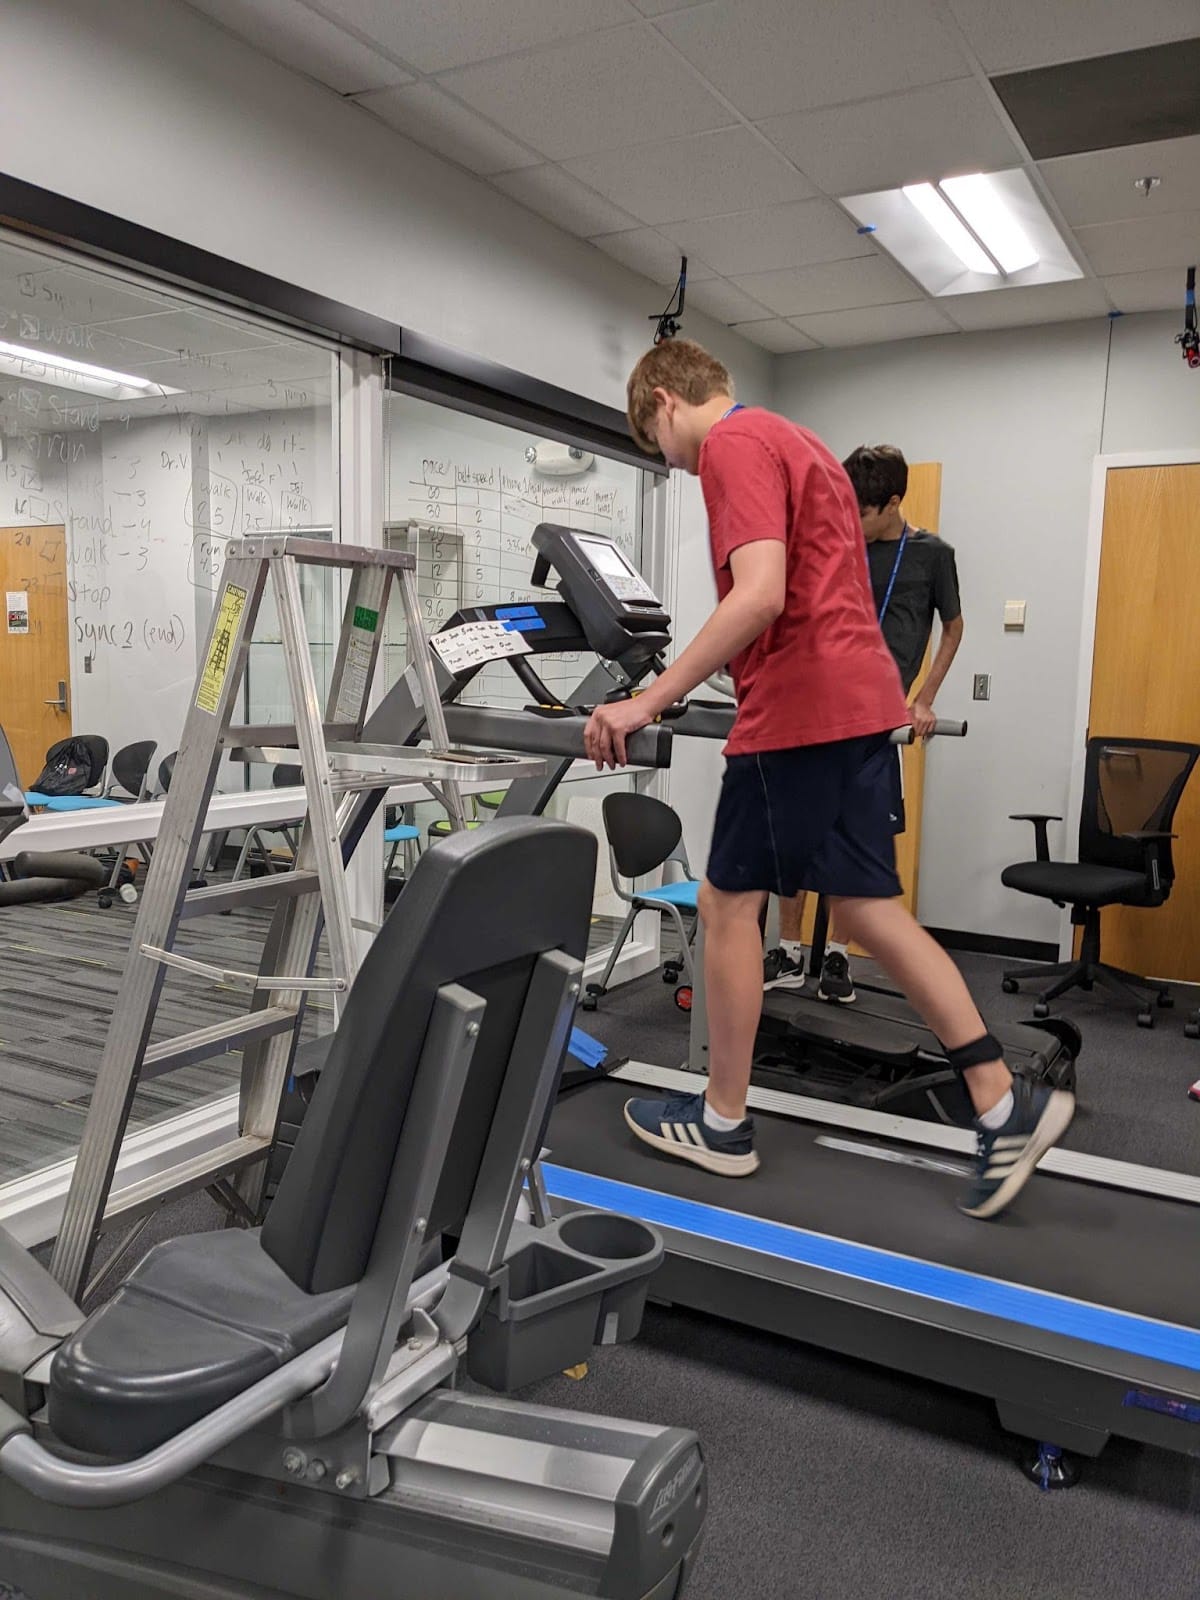
On the first day of machine learning activities, the high school students strapped to their ankle a small Bluetooth sensor by MBIENTLAB capable of measuring acceleration in the x, y, and z directions using an accelerometer.
They followed a specific stand, walk, run protocol on a treadmill with predefined speeds for each stage:
- 1 minute of standing
- 2 minutes of walking
- 2 minutes of running
- 2 minutes of walking
- 1 minute of standing
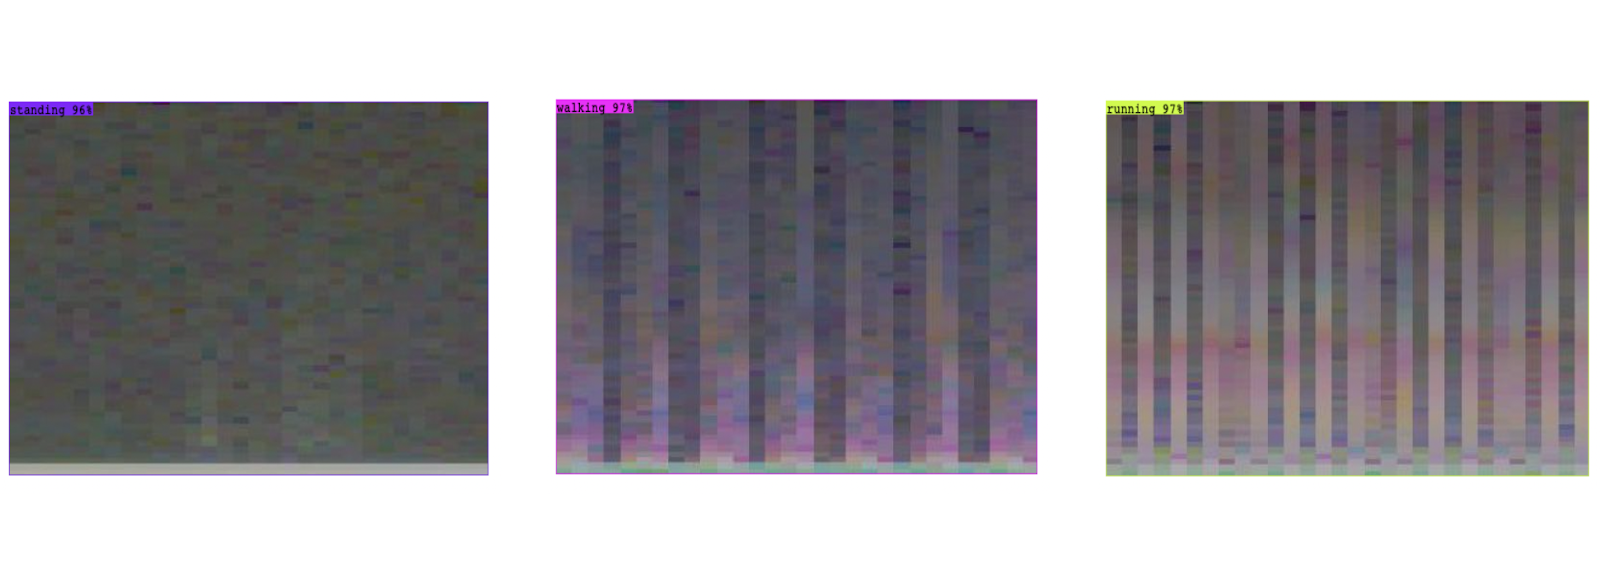
The sensor is able to stream the data in real-time to a phone via Bluetooth. So after transferring the data from a phone to a computer, we converted the accelerometer signals into spectrograms -- image representations of signals. In our case, we mapped the x, y, and z acceleration values to red, green, and blue (RGB) values respectively in an image using the specgram package from matplotlib in Python.
To create our spectrogram image dataset, we went across each participant’s signal using a 10-second time window with 50% overlap to create a single-class image (i. e. standing, walking, or running) for each time window. This way, we can use image classification models out-of-the-box on the spectrograms to distinguish between the different activities.
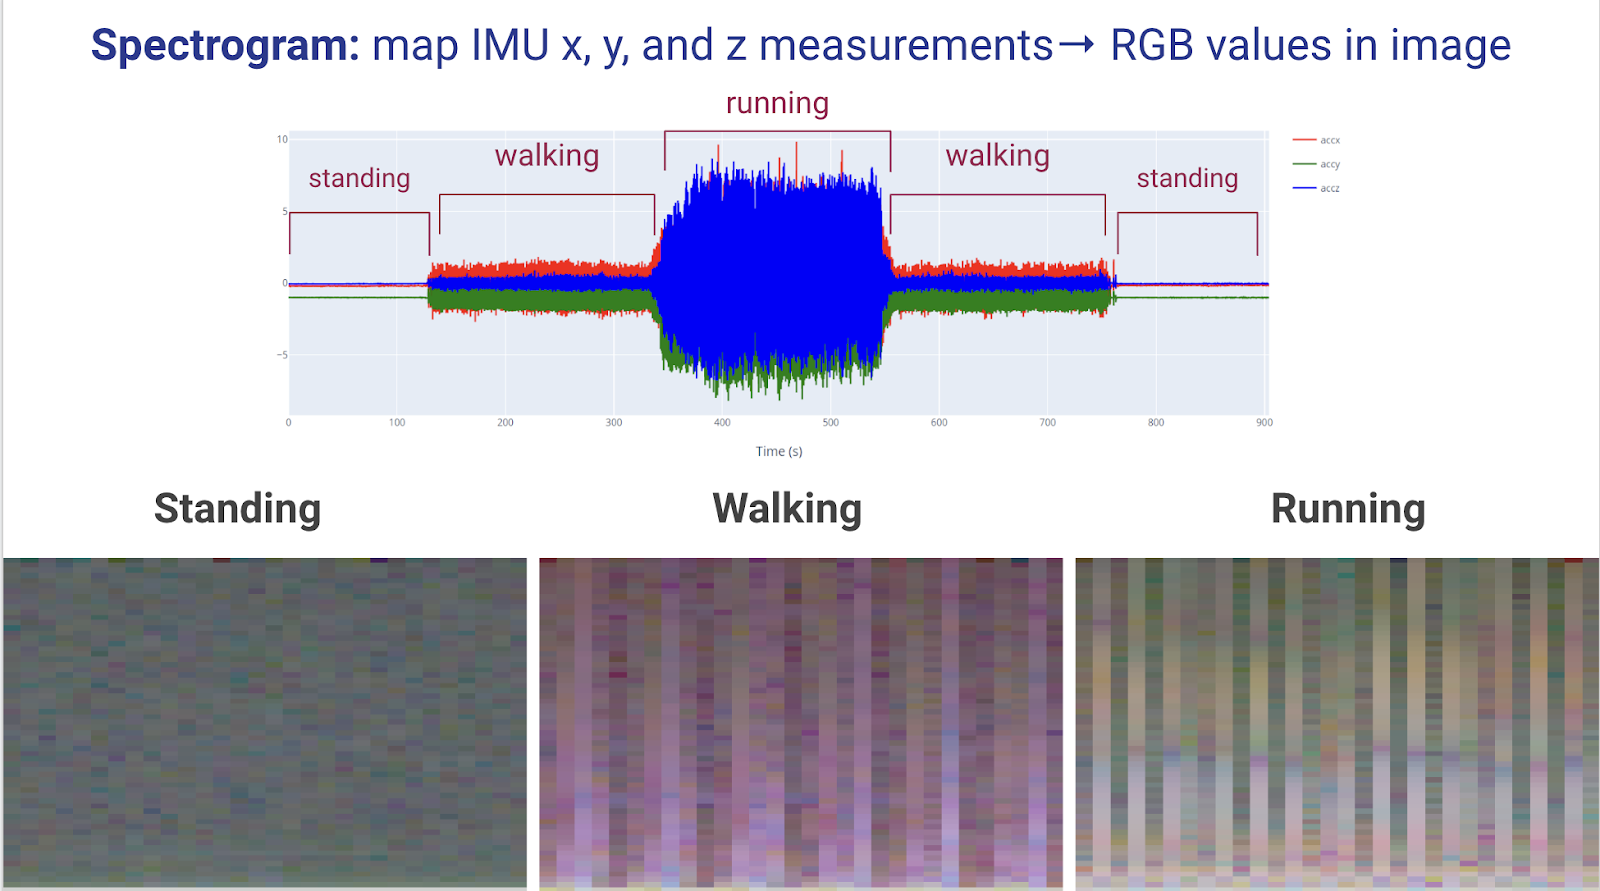
Once we convert the signals into spectrograms, we can see the differences between the images of the three classes. Since an image with RGB values (0, 0, 0) is black and (255, 255, 255) is white, standing is darker, and running is brighter due to the large differences in acceleration in each direction.
After the data had been collected and processed on day one, we were ready to train our computer vision models on day two.
Using Roboflow to Teach Students the Computer Vision Pipeline
At the start of day two, we gave a brief presentation to the students, introducing them to Roboflow and computer vision. We showed some of our projects in Roboflow since our lab has been partnering with them since Fall 2021 on various research projects (ex. computer vision for cotton, microscopic fossils, etc.).
After introducing Roboflow, we gave the students some time to explore Roboflow Universe: “The Largest Resource of Computer Vision Datasets and Pre-Trained Models.” After learning how to use Roboflow Universe, they had the opportunity to explore topics that they are interested in and some hands-on experience in Roboflow before training our custom activity recognition model.
They particularly liked the football player object detection and CSGO aimbot projects. Very on-brand for high school students.
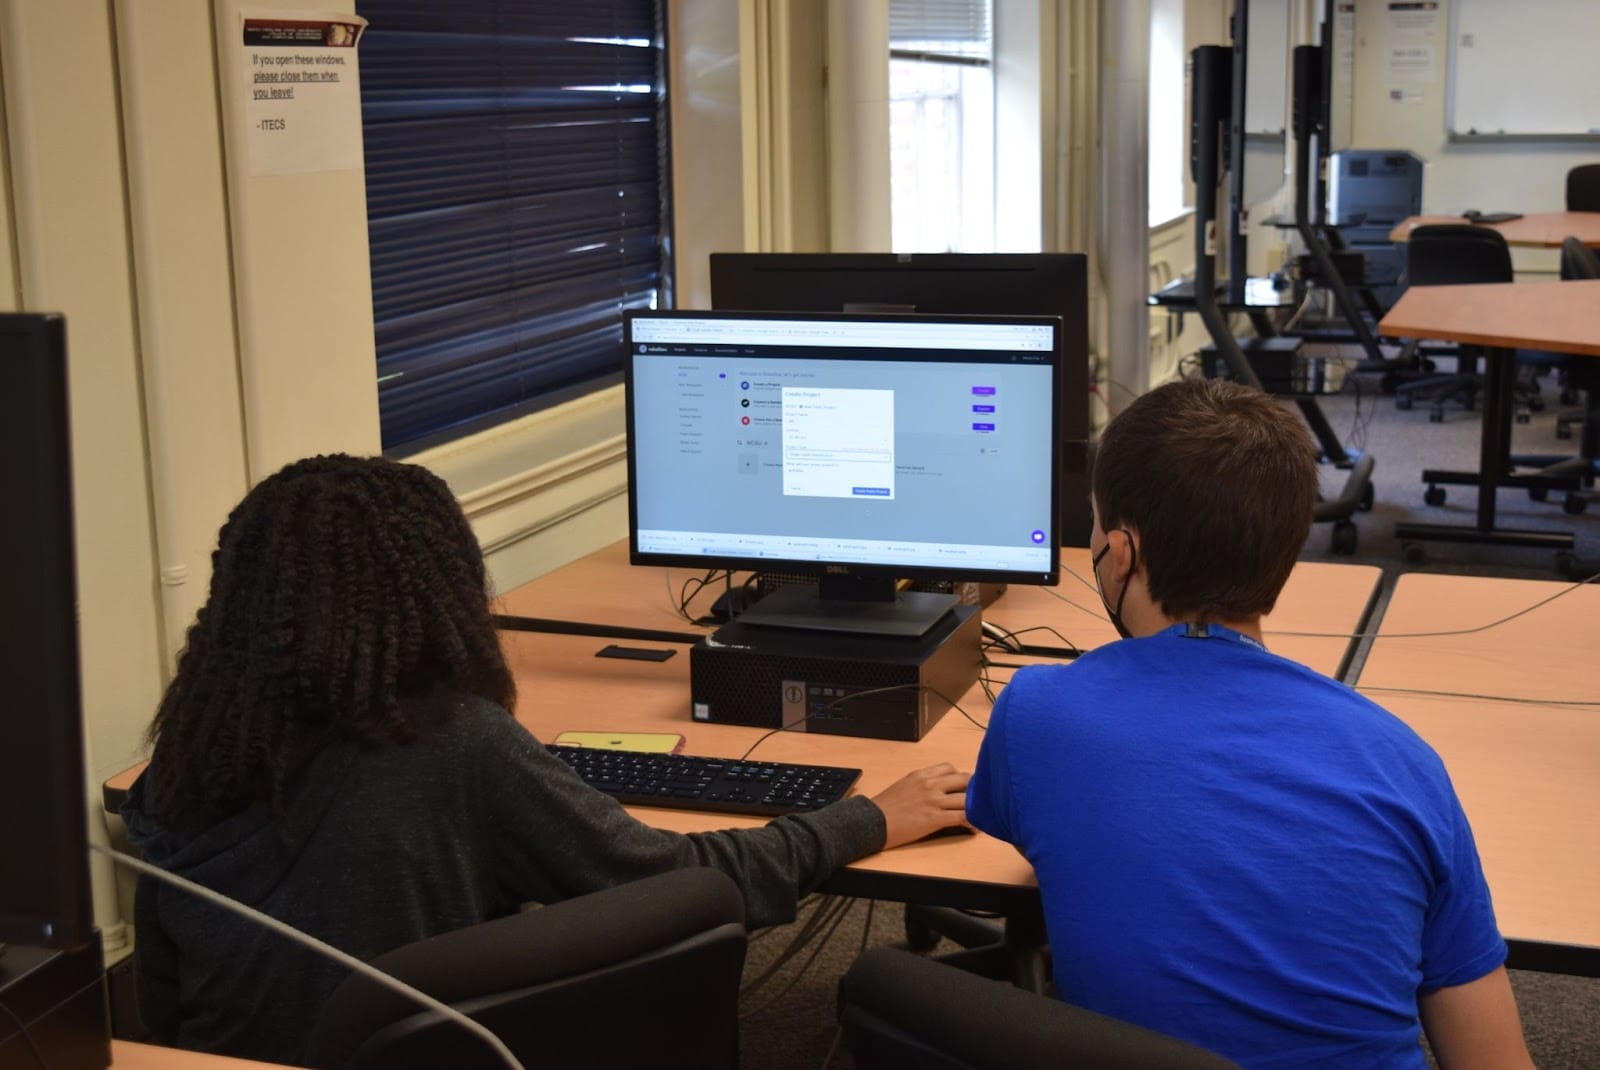
After they explored Roboflow Universe, they started their activity recognition task by first creating image classification projects in their Roboflow accounts and uploading our spectrograms as their training, validation, and testing sets. The dataset consisted of 311 images of standing, 528 images of walking, and 259 images of running.
The students then decided how they wanted to train their models: training-validation-testing split, data augmentations, etc. They would later use their own spectrograms as a holdout dataset for their trained models.
In the end, every group was able to successfully train their own models with high performance on the validation and test sets. We were able to verify their model’s performance by uploading unseen images to their Roboflow project portal and getting predictions almost instantly.
- Training Single-Label Classification Models on Roboflow
- Training Multi-Label Classification Models on Roboflow
- Roboflow's Classification Model Library
Conclusion
It is exciting when high school students are eager to create their own computer vision applications. One student said they wanted to create an application for detecting skin diseases using computer vision.
After all, these students will be the ones to dream of new solutions to the problems facing our world. And I believe computer vision will play a big role in that future.
Acknowledgments
Thank you to The Engineering Place at NC State’s College of Engineering for inviting us to participate in the High School Engineering Summer Day Camps.
Thank you to Dr. Edgar Lobaton for guiding us through the creation of our machine learning lesson plans.
These activities were funded by NSF grants IIS 1915599 and EEC-1160483.
Cite this Post
Use the following entry to cite this post in your research:
Mohamed Traore, Jeremy Park, Sanjana Banerjee. (Sep 5, 2022). Train Activity Recognition Models Using Spectrograms and Computer Vision. Roboflow Blog: https://blog.roboflow.com/spectrograms-computer-vision/